
Brushstrokes in Numbers
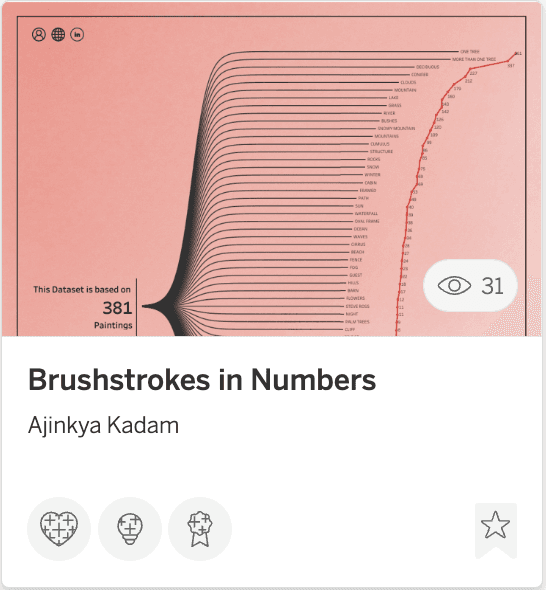
Brushstrokes in Numbers — Bob Ross Painting Analysis
Brushstrokes in Numbers is a data visualisation project that explores 381 paintings by the legendary Bob Ross. Built in Tableau, it takes an unconventional dataset and turns it into something visually compelling — analysing which natural elements, landscapes, and objects appear most frequently across his entire body of work.
What It Shows
The visualisation ranks every element Bob Ross ever painted — from trees and mountains to cabins, rivers, and lakes — by how often they appear across all 381 episodes. Trees dominate, with "One Tree" and "More than One Tree" appearing most frequently, followed by deciduous trees, conifers, clouds, and mountains. The flowing line chart makes the frequency distribution immediately clear and visually striking.
How It's Built
Built entirely in Tableau using the FiveThirtyEight dataset, with a custom warm pink aesthetic designed to complement the natural, painterly theme of the subject matter. The background landscape and typography were carefully chosen to make the data feel like art — not just analysis.
Why It Matters
This project shows that data visualisation is not just about business metrics — it is about finding stories in any dataset and presenting them beautifully. It reflects my ability to think creatively about design while keeping the data accurate and the insight clear.