E commerce dashboard
E-Commerce Dashboard — Customer & Sales Analytics
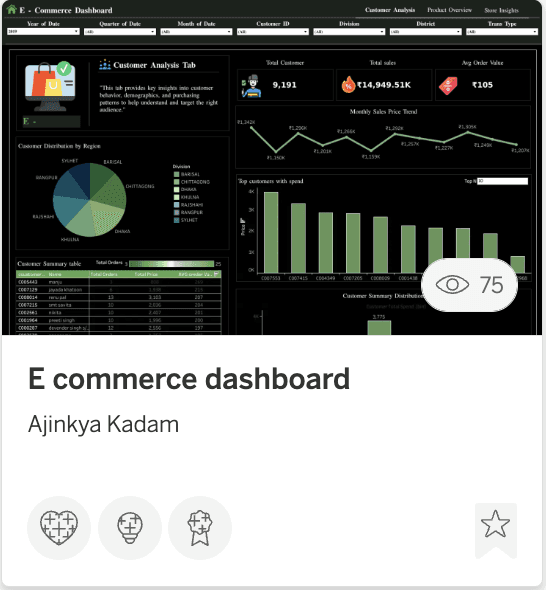
The E-Commerce Dashboard is a comprehensive Tableau project that analyses customer behaviour, sales performance, and store insights for an e-commerce business. With three navigation tabs — Customer Analysis, Product Overview, and Store Insights — it gives a complete 360-degree view of the business in one place.
What It Shows
The Customer Analysis tab tracks 9,191 customers across divisions, with total sales of ₹14,949K and an average order value of ₹105. It includes a monthly sales trend line, top customers by spend, customer distribution by region, a detailed customer summary table, and a customer activity heatmap showing purchase patterns by day and hour across every month of the year.
How It's Built
Built in Tableau with a clean dark theme and green accents, the dashboard uses pie charts, bar charts, trend lines, summary tables, and a detailed activity heatmap — all connected to filters for year, quarter, month, customer ID, division, district, and transaction type. Every filter updates all views simultaneously for seamless exploration.
Why It Matters
This project demonstrates my ability to handle real-world e-commerce analytics — the kind of work that retail and D2C businesses rely on daily to understand their customers and drive revenue decisions. It shows both technical depth and a strong eye for dashboard layout and usability.