GDP of India Dashboard
GDP of India — State-wise Economic Dashboard
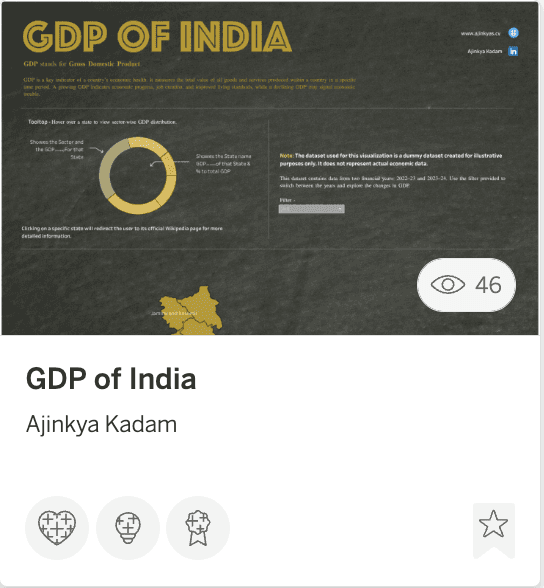
GDP of India is a Tableau visualisation that breaks down India's Gross Domestic Product state by state — covering two financial years, 2022–23 and 2023–24. Built on a dummy dataset created for illustrative purposes, it turns a complex economic concept into a clean, interactive map that anyone can explore and understand.
What It Shows
The dashboard displays a full map of India with all states labelled, allowing users to hover over any state to see its sector-wise GDP distribution and its percentage contribution to the national total. A year filter lets users switch between the two financial years to compare changes. Clicking on any state redirects to its official Wikipedia page for deeper reading.
How It's Built
Built in Tableau with a custom dark earthy aesthetic — gold on black — designed to reflect the weight and significance of economic data. The map uses tooltips with donut charts to show sector-level GDP breakdown per state, combining geography and data in one seamless view.
Why It Matters
This project shows my ability to work with geographic data and build dashboards that go beyond charts — creating an experience that is informative, interactive, and visually distinctive. It reflects a curiosity about real-world data and a commitment to making complex information accessible to everyone.