Zepto Inventory Dashbaord
Zepto Inventory Insights — Excel Inventory Analytics Dashboard
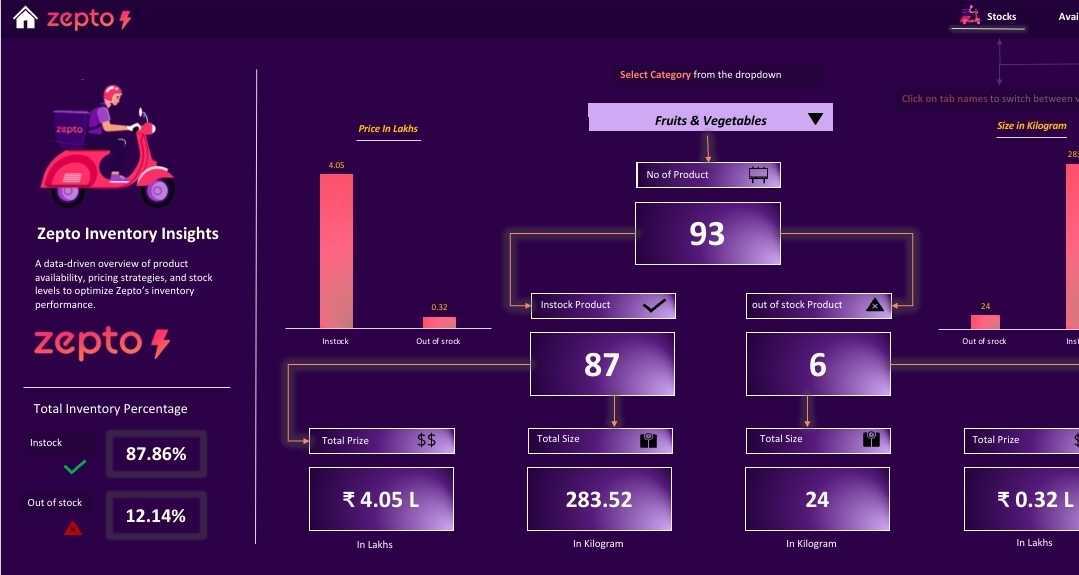
Zepto Inventory Insights is an Excel dashboard built to provide a data-driven overview of product availability, pricing strategies, and stock levels — modelled around Zepto's quick-commerce inventory management workflow. Built entirely in Microsoft Excel using real data sourced online, it demonstrates that powerful analytics does not always require complex tools.
What It Shows
The dashboard tracks inventory performance by product category — showing total products, instock vs out-of-stock counts, total inventory value in lakhs, and total stock size in kilograms. With 87.86% of inventory instock and 12.14% out of stock, the dashboard gives instant visibility into stock health. A category dropdown filter lets users switch between product categories like Fruits & Vegetables to explore performance at a granular level.
How It's Built
Built entirely in Microsoft Excel with a custom dark purple Zepto-branded design — matching the company's actual visual identity. The dashboard uses bar charts, KPI cards, dropdown filters, and a flow-based layout that guides the eye from category selection to stock breakdown to value and size metrics seamlessly.
Why It Matters
This project shows versatility — the ability to build professional, branded analytics dashboards in Excel, not just BI tools like Tableau. It reflects the practical, tool-agnostic approach I bring to every analytics problem: use whatever it takes to get the insight across clearly.