Social Media Engagement Dashboard
Social Media Engagement Dashboard
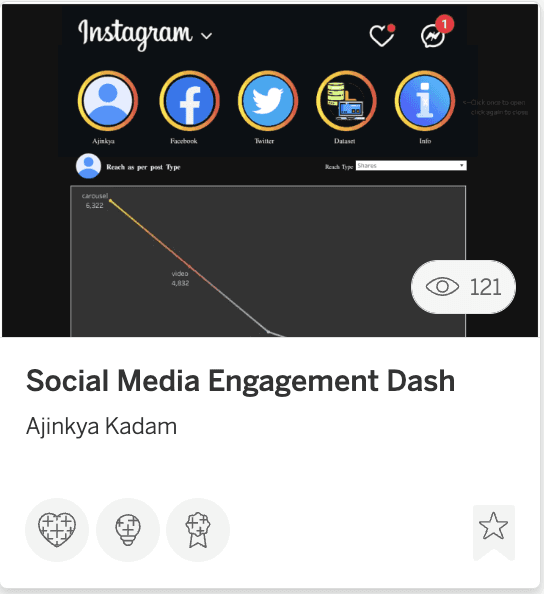
The Social Media Engagement Dashboard is a Tableau project that analyses post performance across Instagram, Facebook, and Twitter — designed to look and feel like the actual social media platforms themselves. Each dashboard is skinned to match its platform's native UI, making the data immediately familiar and intuitive to anyone who uses social media.
What It Shows
Each platform view tracks three key insights — reach by post type, sentiment breakdown by content format, and a best time to post heatmap by day and time slot. Across all three platforms, carousel posts consistently lead in reach, while the heatmap reveals which day and time combinations drive the highest engagement.
How It's Built
Built entirely in Tableau with custom platform-themed designs — dark mode for Instagram, light for Twitter, and blue for Facebook. Each dashboard uses line charts, grouped bar charts, and heatmaps, all styled to match the platform's visual identity. Navigation icons allow switching between platforms seamlessly.
Why It Matters
This project demonstrates both analytical depth and creative design thinking — showing that a dashboard does not have to look like a dashboard to communicate clearly. It reflects my ability to build visualisations that are not just accurate, but genuinely engaging to explore.