Growing Companies Dashboard
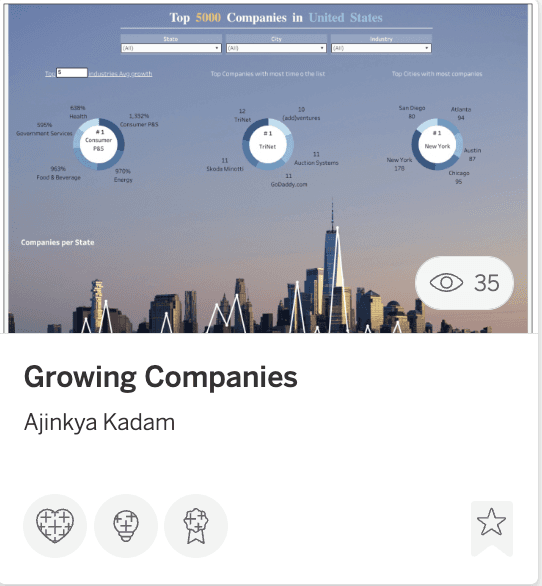
Top 5000 Growing Companies — US Business Intelligence Dashboard
The Growing Companies Dashboard is a Tableau project that analyses the top 5000 fastest-growing companies in the United States, highlighting industry trends, state-wise distribution, revenue performance, and individual company insights — all in one visually striking interactive dashboard.
What It Shows
The dashboard covers three key areas — top industries by average growth rate, top companies by frequency on the list, and top cities by number of companies. Consumer P&S leads industry growth at 1,332%, TriNet tops the company rankings, and New York leads all cities with 178 companies. A state-level line and bar chart shows both company count and revenue per state, while a dynamic summary table ranks all 5,000 companies with details on industry, revenue, growth, and workforce size.
How It's Built
Built in Tableau with a dramatic New York City skyline background, the dashboard overlays data visualisations directly onto the cityscape — creating a visually immersive experience. Filters for state, city, and industry update all views simultaneously. A rank lookup feature at the bottom lets users enter any rank number and instantly pull up that company's full details.
Why It Matters
This project demonstrates my ability to work with large, multi-dimensional datasets and build dashboards that are both analytically deep and visually impressive. It reflects the kind of business intelligence thinking that helps organisations benchmark performance, spot industry trends, and make smarter strategic decisions.