Sample Superstore - Region Analysis Dashboard
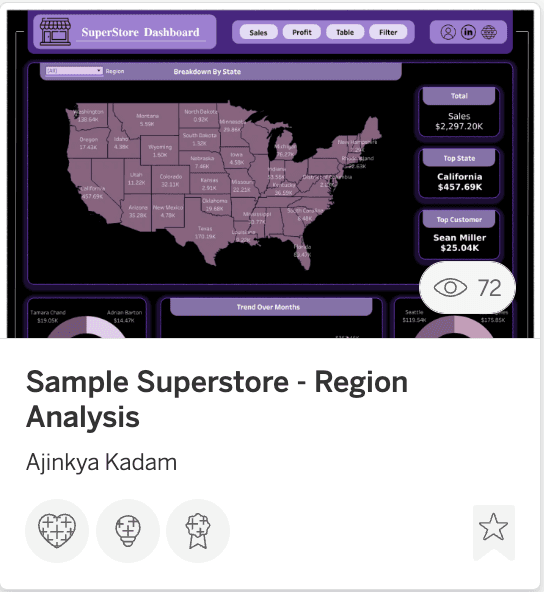
SuperStore Dashboard — Regional Sales & Profit Analysis
SuperStore Dashboard is a Tableau practice project built on the classic Sample Superstore dataset — designed to demonstrate advanced data visualisation skills across sales, profit, and customer performance. The dashboard brings together multiple views into one clean, interactive experience that makes it easy to explore business performance at any level of detail.
What It Shows
The dashboard covers four key areas — Sales breakdown by state across the US, top customers by revenue, monthly sales trends, and category-wise performance across all product sub-categories. A tabular view is also included for granular order-level analysis, giving users both the big picture and the fine detail in one place.
How It's Built
Built entirely in Tableau with a custom dark purple design using Figma, the dashboard uses interactive filters, donut charts, a US map, trend lines, and bar charts — all working together seamlessly. Navigation tabs allow switching between Sales, Profit, Table, and Filter views instantly.
Why It Matters
This project showcases my ability to take a raw dataset and turn it into a polished, professional dashboard that any business stakeholder could use. It reflects the same design standards and analytical thinking I bring to every real-world project.